

Situation
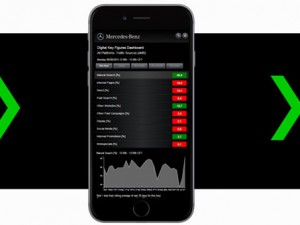
Identification tool and showpiece for the digital world: the TV Digital Analytics dashboard.
Following the example of the massive stock exchange floors in NYSE, London and Frankfurt, a central TV dashboard was created. Our central TV dashboard shows the most important key figures at a glance and is constantly updated.
It’s impressive, with a brilliant design and appearance instead of Excel chart visuals: A dashboard that is fun and intuitive. The design is flexibly adaptable to corporate design and can be viewed on a TV (Full HD), tablet or desktop.
Through the T4 API-Explorer™, the dashboard can be connected to the Adobe Analytics interface or other standardized interfaces for data supply.
Solution
The “made to measure” under the dashboards.
The most important KPIs and performance corridors are displayed. The target achievement is also displayed.
Attentive Executive Dashboard; unique in look, feel and animation.
Near real-time data (-2h)
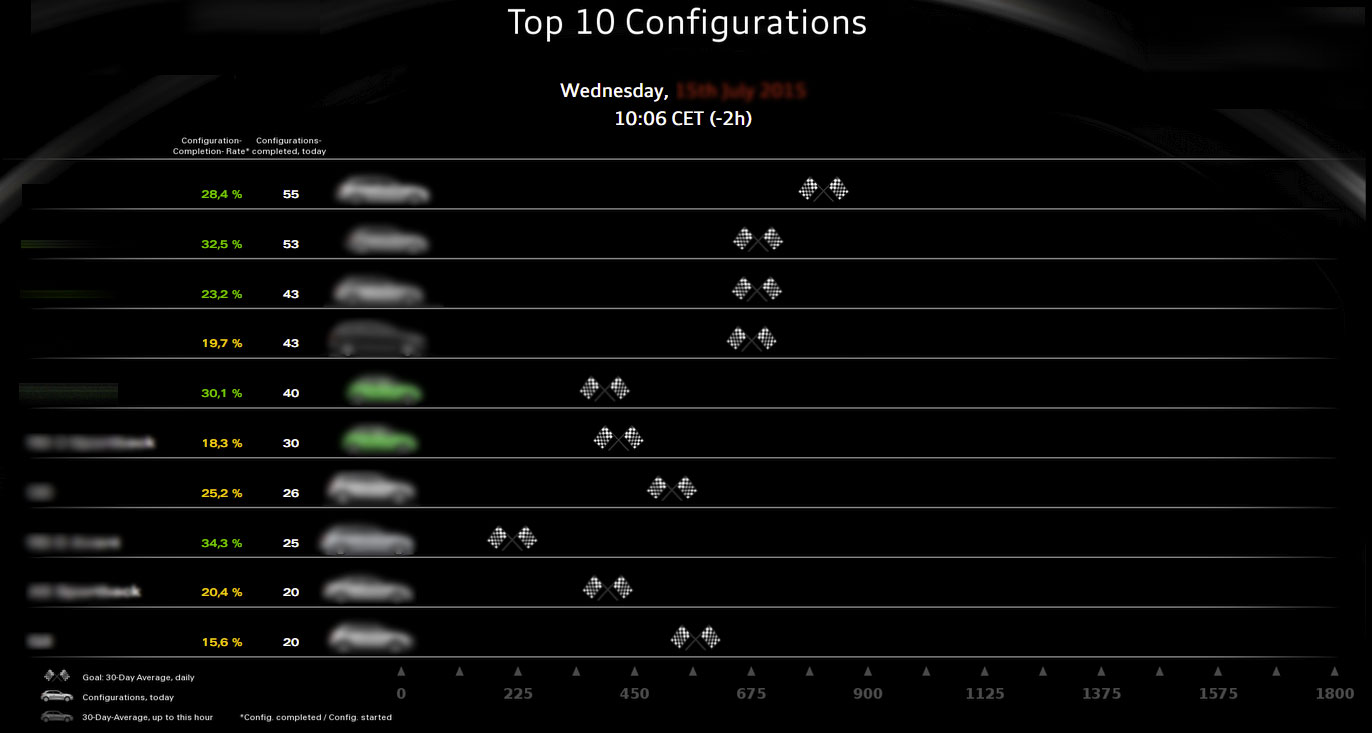
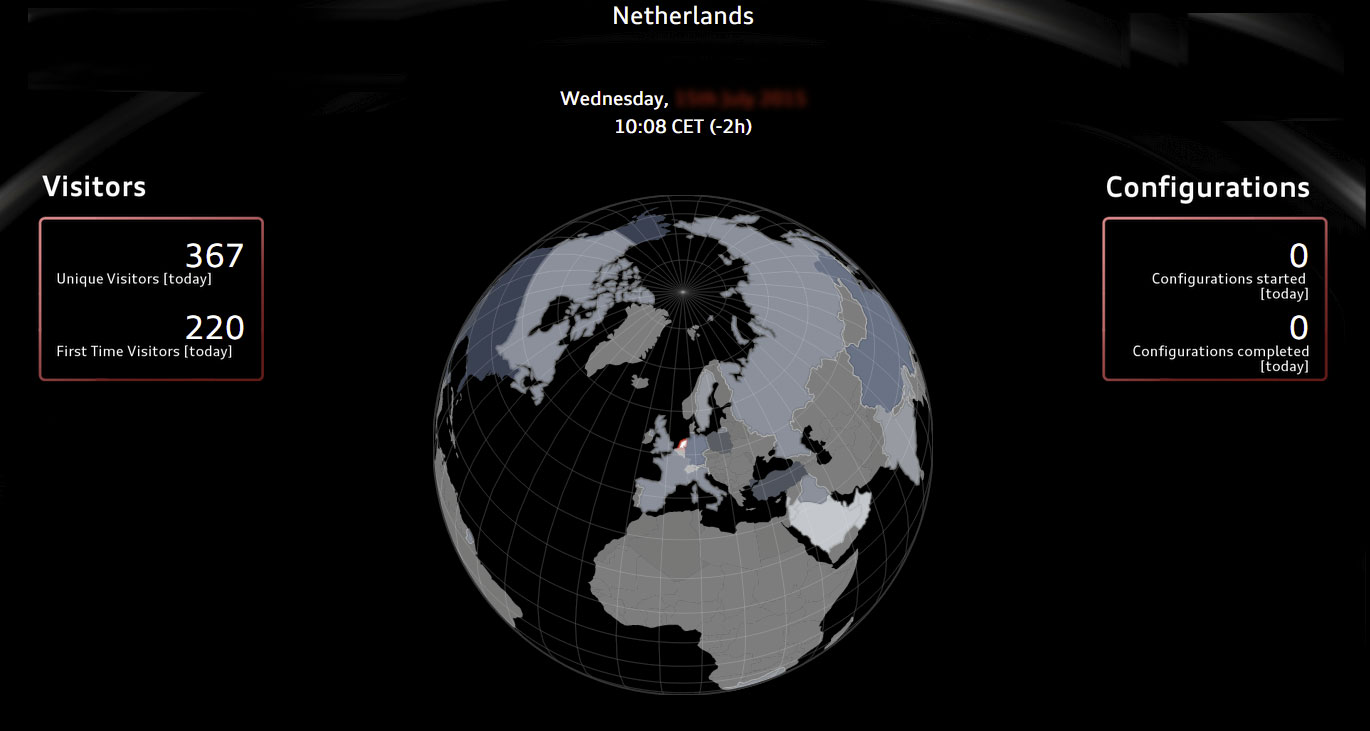
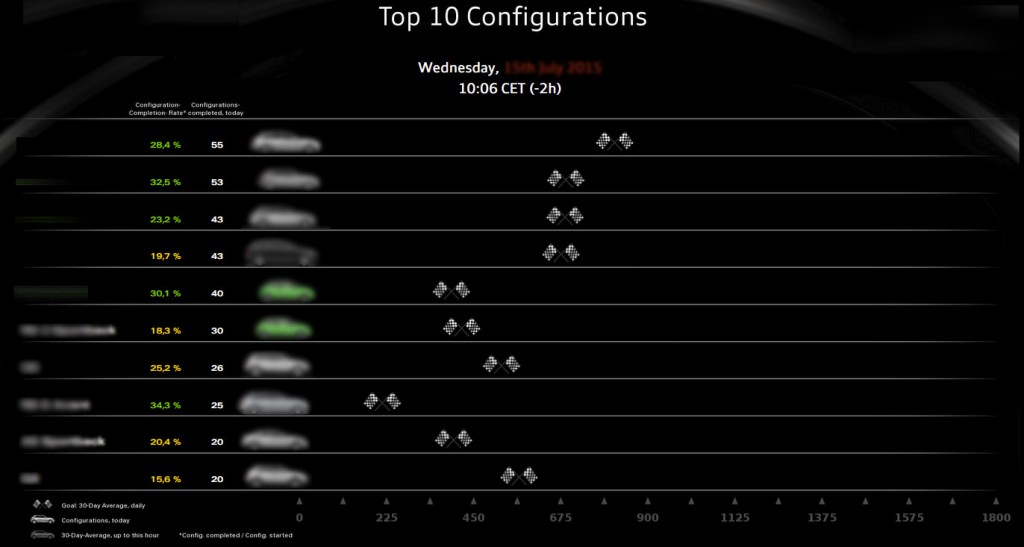
Panels: Cockpit, Racing Chart and 3D World-map
Components
Components:
T4Api Explorer™
Mathematical model for live calculation and adjustment of moving averages and corridors
Data management & rights management
TV dashboard with automatic controller
Data-Sources & APIs:
Adobe Analytics API, Facebook, Youtube APIs
Technical Framework:
Enterprise ETL-Layer, MySQL
Yii Framework + Json
Visualization Framework:
Data Driven Documents (D3) – flexibly adaptable, almost any layout can be realized
Project Modules
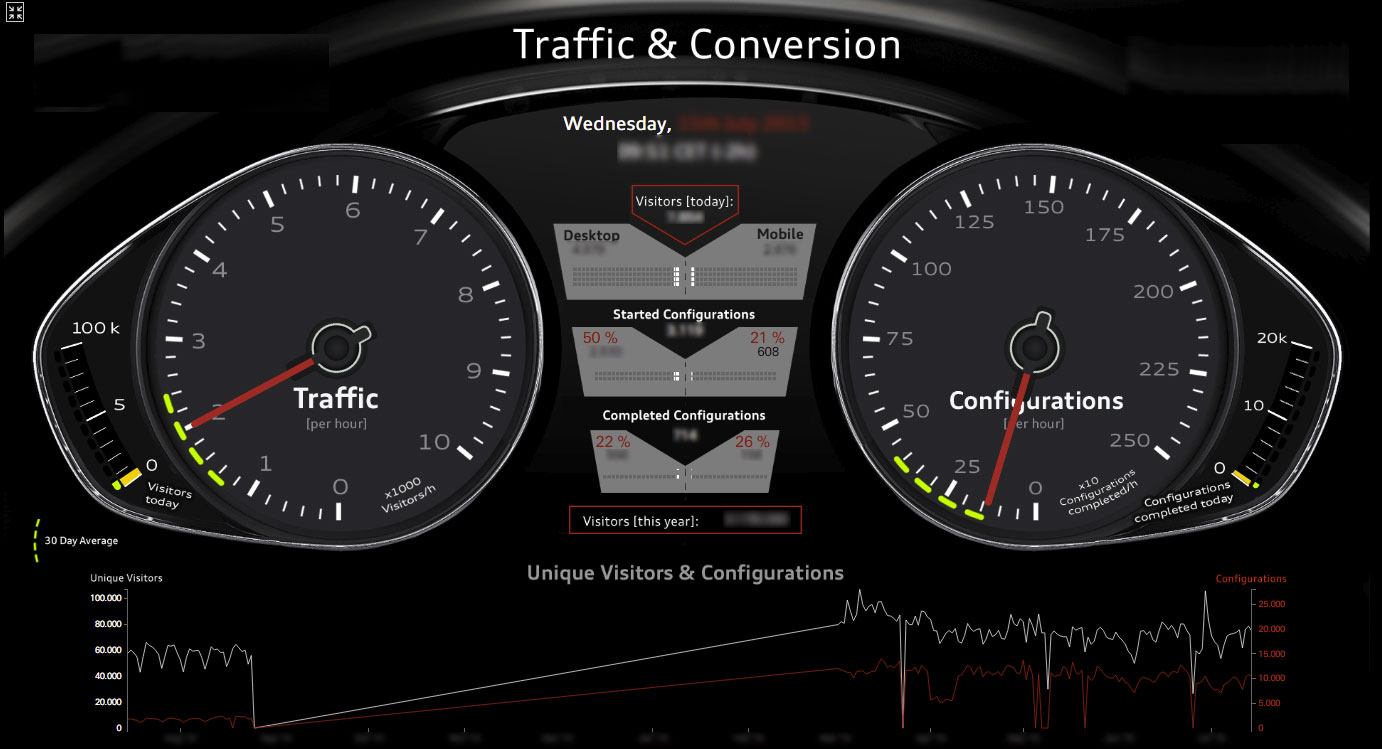
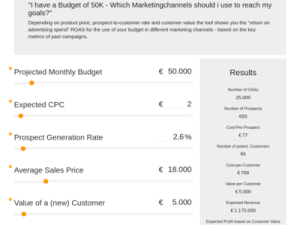
KPI Cockpit
A “cockpit” design as dashboard with the display of the most important KPIs Visits, Configurations etc. in real time.
Calculated performance corridors and goal monitoring provide the indispensable context information.
D3 (Data Driven Documents) enables a flexible, individual design solution
